Graphing memory usage during an MTR run
In order to optimally size the amount of RAM to allocate to a set of new
machines for running MTR, I ran a few tests to check the memory usage of an MTR
run for mysql-trunk and cluster-7.1. As using a RAM disk considerably speeds
things up, I set the vardir to be on /ramdisk and logged the usage of that
too.
The tests were performed on an 8-core E5450 @ 3.00GHz with 24GB RAM, with 8GB
allocated to /ramdisk. Each branch ran the default.daily collection, which
generally contains the most testing we do per-run. Between each run I rebooted
the machine to clear the buffer cache and /ramdisk.
I used something like the script below, which saved the per-second usage of
/ramdisk, the total RAM used, and the RAM used minus buffers.
#!/bin/bash

BRANCH="mysql-trunk"
BUILDDIR="mysql-5.6.3-m5-linux2.6-x86_64"
TESTDIR="${HOME}/mtr-test/${BRANCH}"

stats()
{
  i=1
  rm -f ${TESTDIR}/stats-${BRANCH}
  while [ -f ${TESTDIR}/running ]; do
    rd=$(df -k /ramdisk | awk '/^\// {print $3}')
    mem=$(free | awk '/^Mem/ {print $3}')
    mem1=$(free | awk '/cache:/ {print $3}')
    echo "${i} ${rd} ${mem} ${mem1}" >>${TESTDIR}/stats-${BRANCH}
    i=$((i+1))
    sleep 1
  done
}

export TMPDIR="${TESTDIR}/tmp"
rm -rf ${TMPDIR}
mkdir -p ${TMPDIR}

>${TESTDIR}/running
stats &

(
  cd ${TESTDIR}/${BUILDDIR}/mysql-test

  perl mysql-test-run.pl ... --parallel=8 --vardir=/ramdisk/mtr-${BRANCH}/...
  mv /ramdisk/mtr-${BRANCH}/* ${TMPDIR}/
  ...
)

sync
rm -f ${TESTDIR}/running
wait
First I graphed a straight run of the two branches, using the following gnuplot script:
set terminal png enhanced font "Times,11" size 640,768
set output "mtr-ram.png"
set title "MTR memory usage (8-core Xeon, 24GB, 8GB RAM disk)"
set xlabel "Time (minutes)"
set ylabel "Memory usage (GB)"
set yrange [0:16]
set xtics 10
set key top box
set grid
plot "stats-mysql-trunk" every 60 using (($1)/60):(($2)/1024/1024) \
        title 'mysql-trunk /ramdisk usage' with lines, \
     "stats-mysql-trunk" every 60 using (($1)/60):(($3)/1024/1024) \
        title 'mysql-trunk RAM (inc buf)' with lines, \
     "stats-mysql-trunk" every 60 using (($1)/60):(($4)/1024/1024) \
        title 'mysql-trunk RAM (exc buf)' with lines, \
     "stats-mysql-cluster-7.1" every 60 using (($1)/60):(($2)/1024/1024) \
        title 'cluster-7.1 /ramdisk usage' with lines, \
     "stats-mysql-cluster-7.1" every 60 using (($1)/60):(($3)/1024/1024) \
        title 'cluster-7.1 RAM (inc buf)' with lines, \
     "stats-mysql-cluster-7.1" every 60 using (($1)/60):(($4)/1024/1024) \
        title 'cluster-7.1 RAM (exc buf)' with lines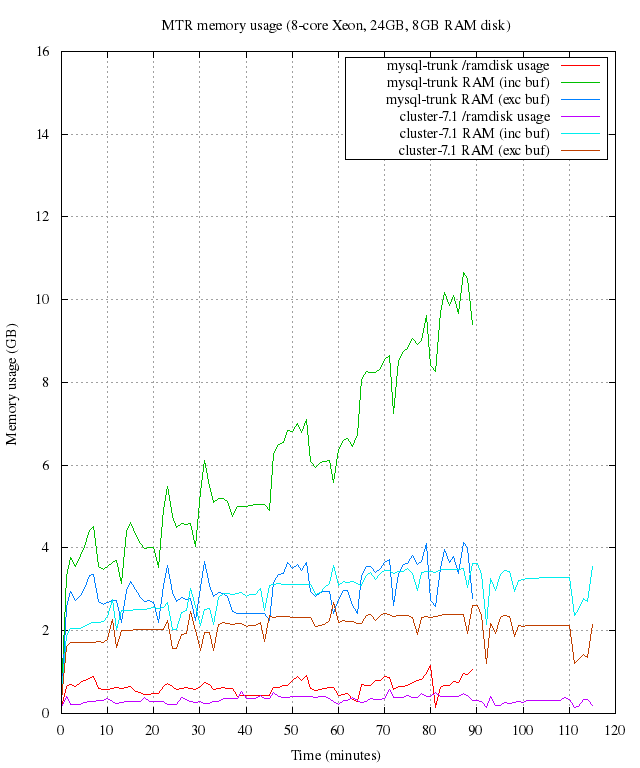
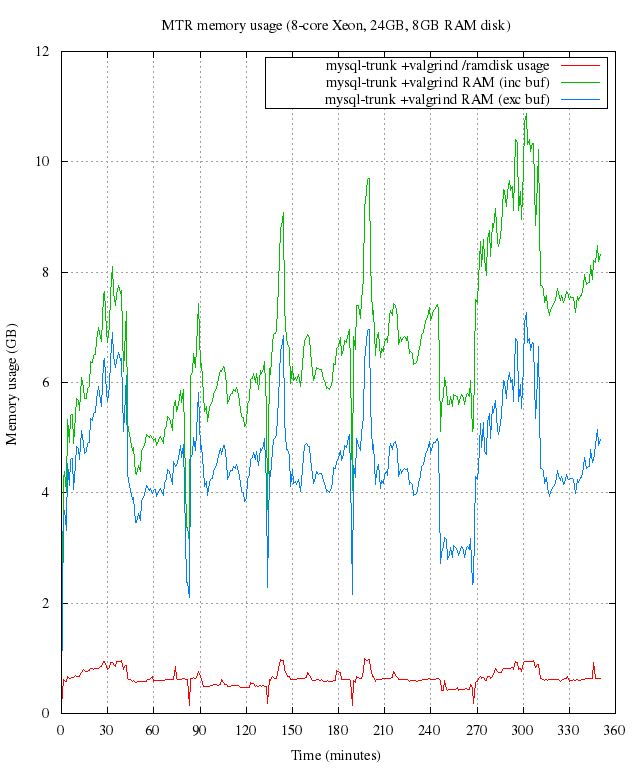
I then performed a valgrind run on mysql-trunk using similar scripts. As valgrind takes considerably longer (and uses more RAM) I kept it separate as the combined graph isn’t very clear:
So, based on these results, the host machine (16GB RAM + 8GB RAM disk) is probably a sensible guide for now, and allows for some future growth.
All Posts
- 16 Jul 2015 » Reducing RAM usage in pkgin
- 03 Mar 2015 » pkgsrc-2014Q4: LTS, signed packages, and more
- 06 Oct 2014 » Building packages at scale
- 04 Dec 2013 » A node.js-powered 8-bit CPU - part four
- 03 Dec 2013 » A node.js-powered 8-bit CPU - part three
- 02 Dec 2013 » A node.js-powered 8-bit CPU - part two
- 01 Dec 2013 » A node.js-powered 8-bit CPU - part one
- 21 Nov 2013 » MDB support for Go
- 30 Jul 2013 » What's new in pkgsrc-2013Q2
- 24 Jul 2013 » Distributed chrooted pkgsrc bulk builds
- 07 Jun 2013 » pkgsrc on SmartOS - creating new packages
- 15 Apr 2013 » What's new in pkgsrc-2013Q1
- 19 Mar 2013 » Installing SVR4 packages on SmartOS
- 27 Feb 2013 » SmartOS is Not GNU/Linux
- 18 Feb 2013 » SmartOS development preview dataset
- 17 Jan 2013 » pkgsrc on SmartOS - fixing broken builds
- 15 Jan 2013 » pkgsrc on SmartOS - zone creation and basic builds
- 10 Jan 2013 » Multi-architecture package support in SmartOS
- 09 Jan 2013 » Solaris portability - cfmakeraw()
- 08 Jan 2013 » Solaris portability - flock()
- 06 Jan 2013 » pkgsrc-2012Q4 illumos packages now available
- 23 Nov 2012 » SmartOS and the global zone
- 24 Oct 2012 » Setting up Samba on SmartOS
- 10 Oct 2012 » pkgsrc-2012Q3 packages for illumos
- 23 Aug 2012 » Creating local SmartOS packages
- 10 Jul 2012 » 7,000 binary packages for OSX Lion
- 09 Jul 2012 » 9,000 packages for SmartOS and illumos
- 07 May 2012 » Goodbye Oracle, Hello Joyent!
- 13 Apr 2012 » SmartOS global zone tweaks
- 12 Apr 2012 » Automated VirtualBox SmartOS installs
- 30 Mar 2012 » iptables script for Debian / Ubuntu
- 20 Feb 2012 » New site design
- 11 Jan 2012 » Set up anonymous FTP upload on Oracle Linux
- 09 Jan 2012 » Kickstart Oracle Linux in VirtualBox
- 09 Jan 2012 » Kickstart Oracle Linux from Ubuntu
- 22 Dec 2011 » Last day at MySQL
- 15 Dec 2011 » Installing OpenBSD with softraid
- 21 Sep 2011 » Create VirtualBox VM from the command line
- 14 Sep 2011 » Creating chroots for fun and MySQL testing
- 30 Jun 2011 » Graphing memory usage during an MTR run
- 29 Jun 2011 » Fix input box keybindings in Firefox
- 24 Jun 2011 » How to lose weight
- 23 Jun 2011 » How to fix stdio buffering
- 13 Jun 2011 » Serving multiple DNS search domains in IOS DHCP
- 13 Jun 2011 » Fix Firefox URL double click behaviour
- 20 Apr 2011 » SSH via HTTP proxy in OSX
- 09 Nov 2010 » How to build MySQL releases
- 29 Apr 2010 » 'apt-get' and 5,000 packages for Solaris10/x86
- 16 Sep 2009 » ZFS and NFS vs OSX
- 12 Sep 2009 » pkgsrc on Solaris
- 09 Dec 2008 » Jumpstart from OSX
- 31 Dec 2007 » Set up local caching DNS server on OSX 10.4